Tidy geographic data
with sf, dplyr, ggplot2, geos and friends
Introduction
Session overview
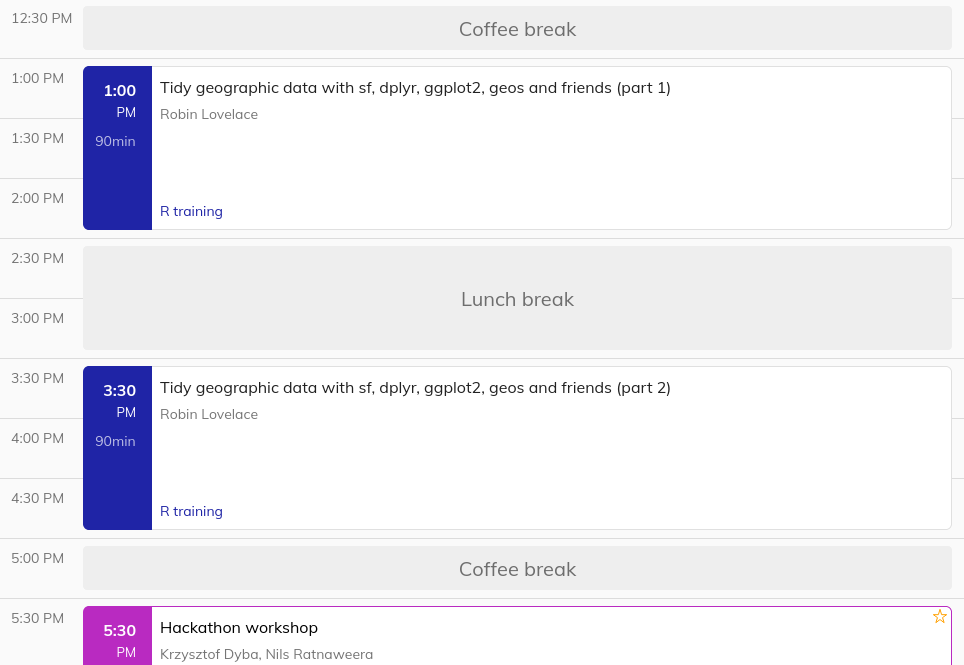
Source: pretalx.earthmonitor.org/opengeohub-summer-school-2023/schedule/v/0.7/
System dependencies
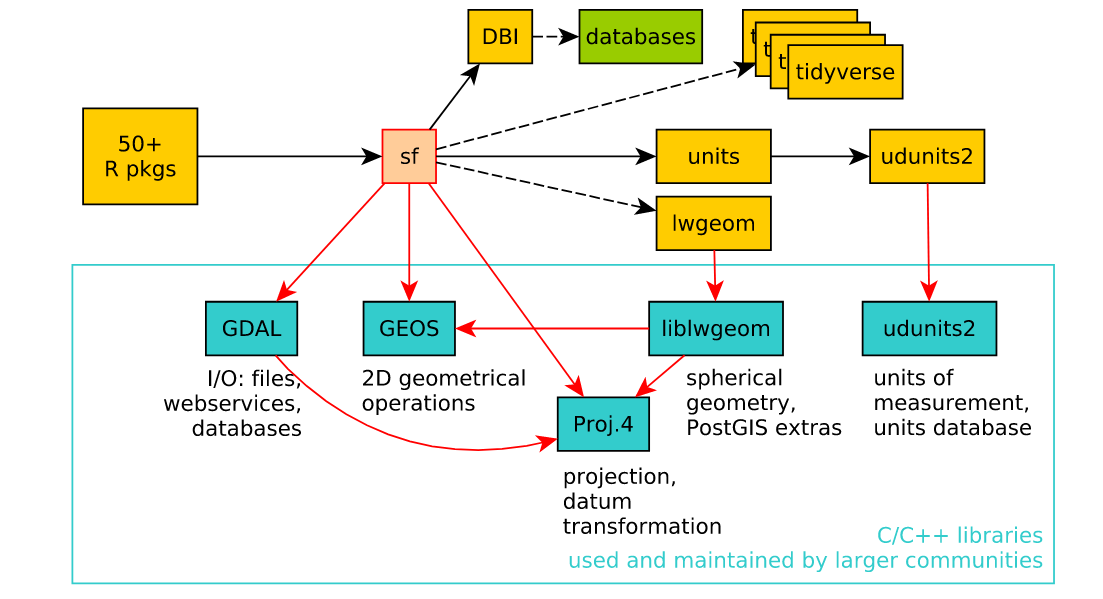
Source: Pebesma (2018)
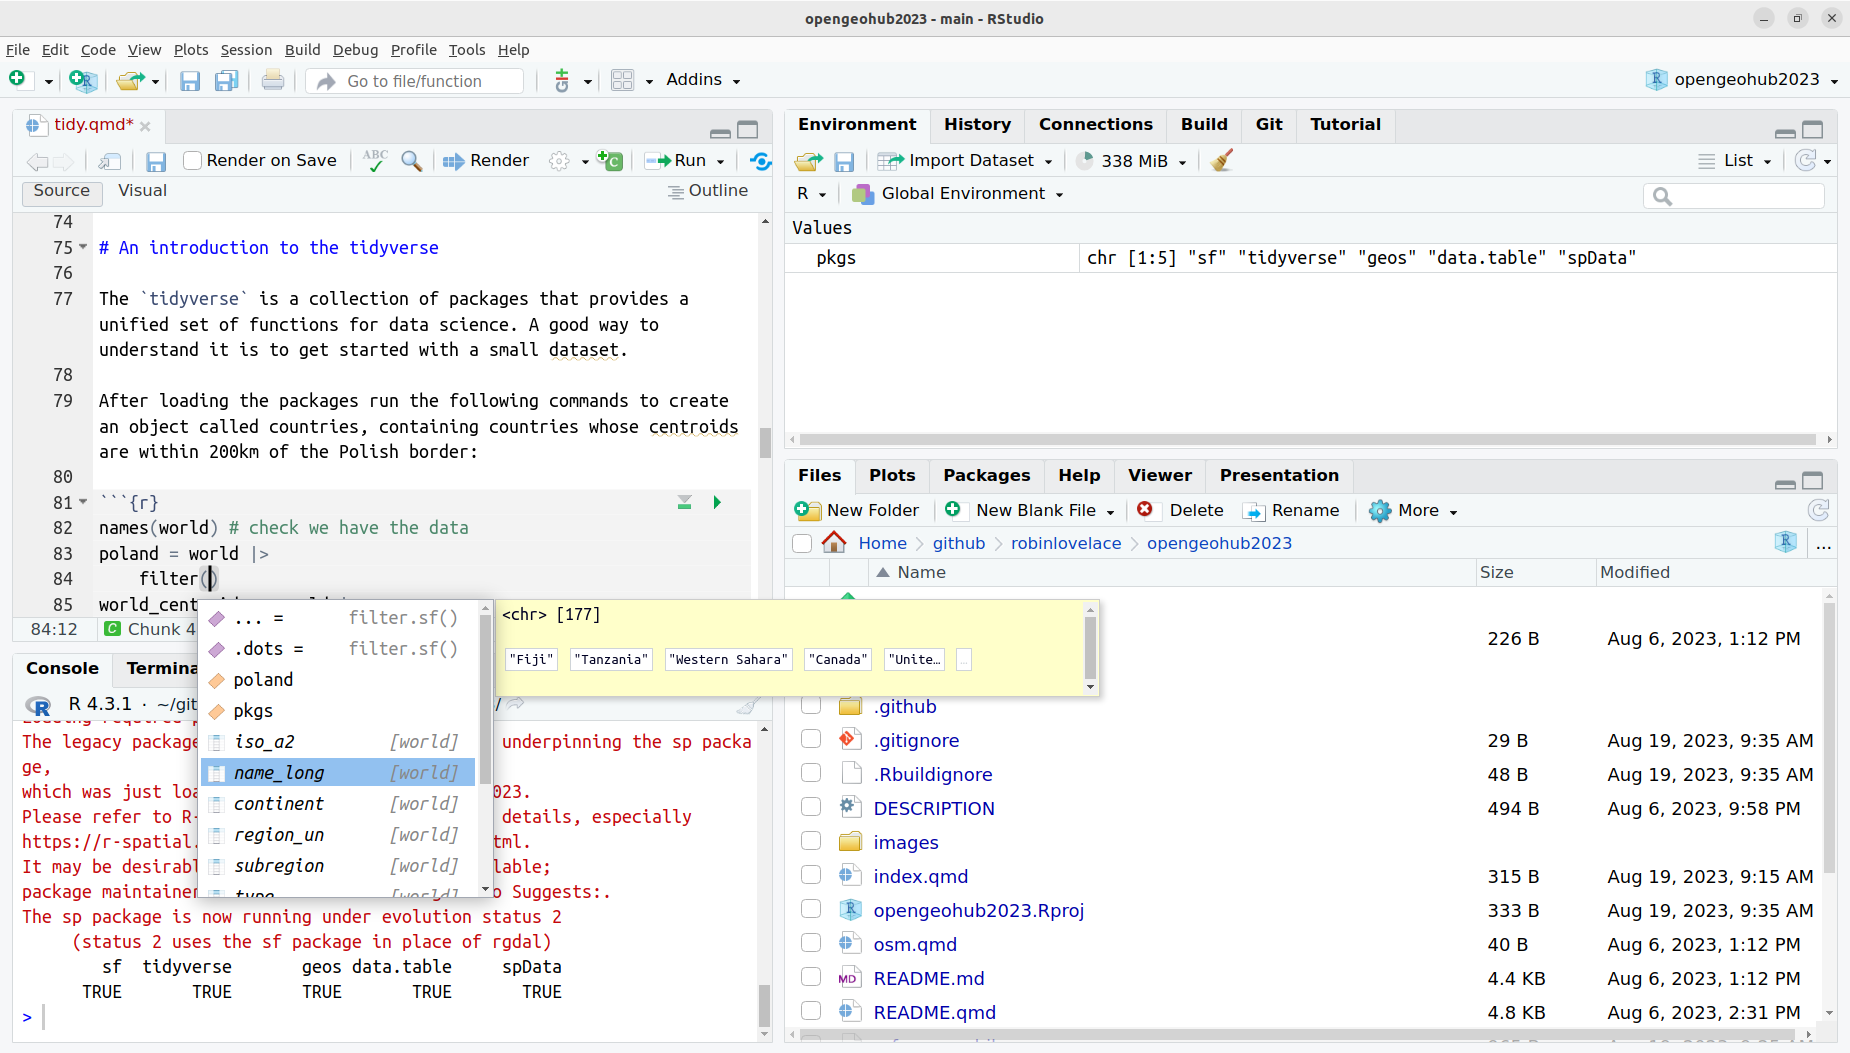
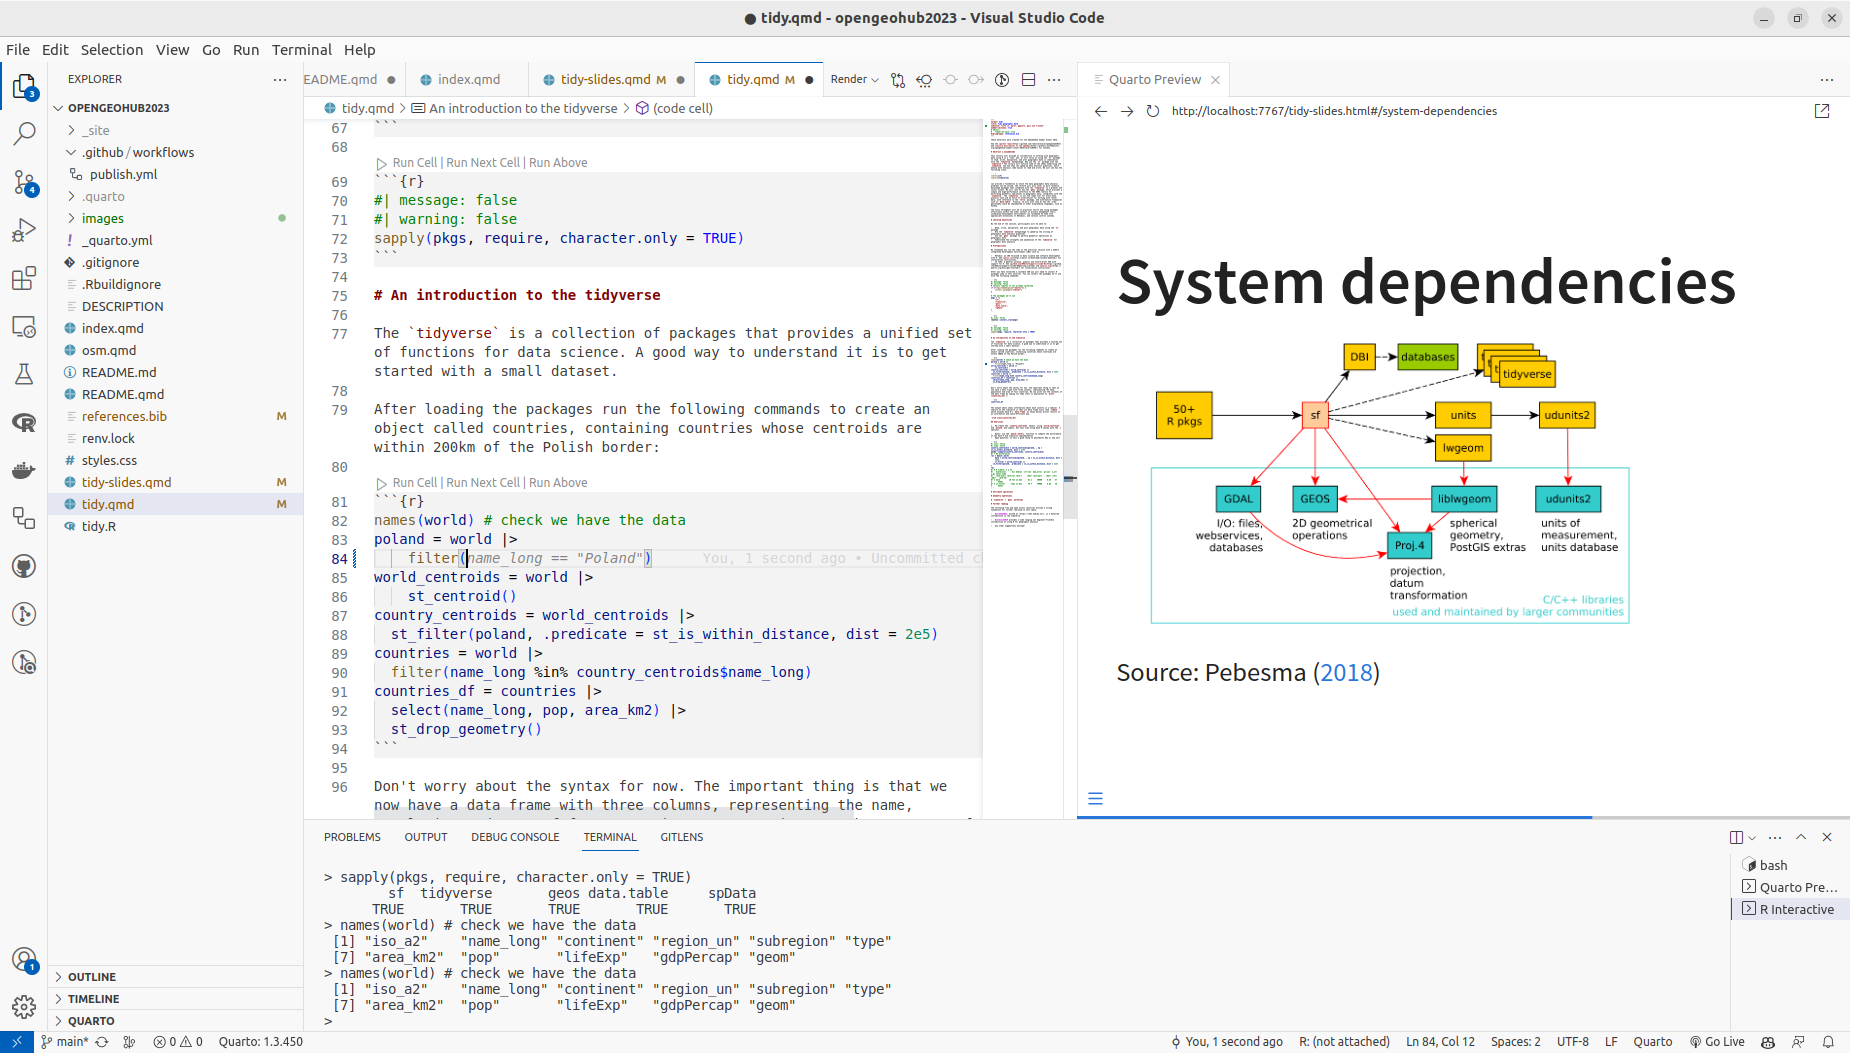
Development environments
RStudio
VS Code
Part 1: sf + dplyr
Key features of sf
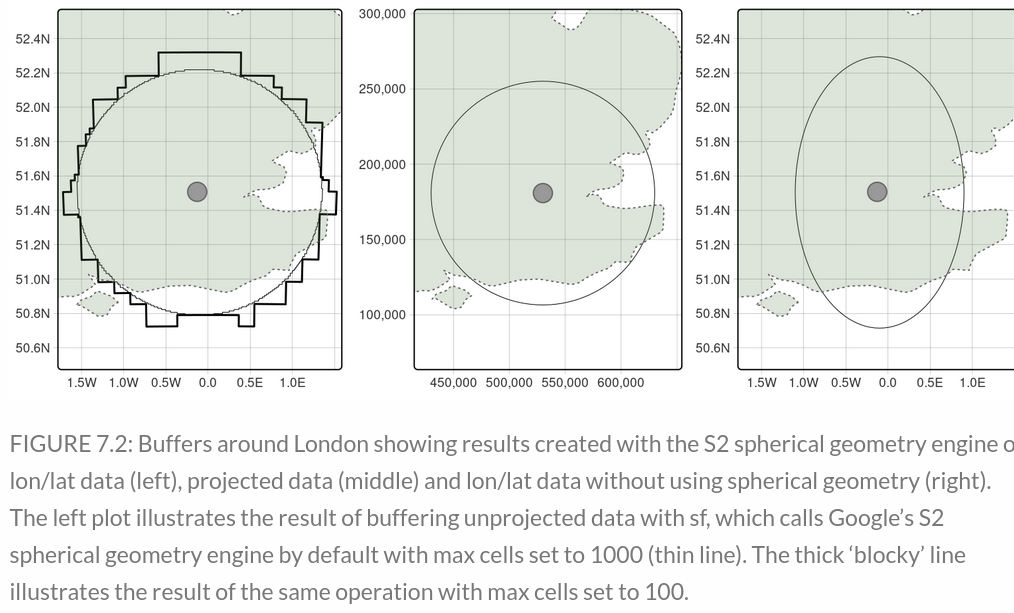
Source: Lovelace, Nowosad, and Muenchow (2019)
sf functions
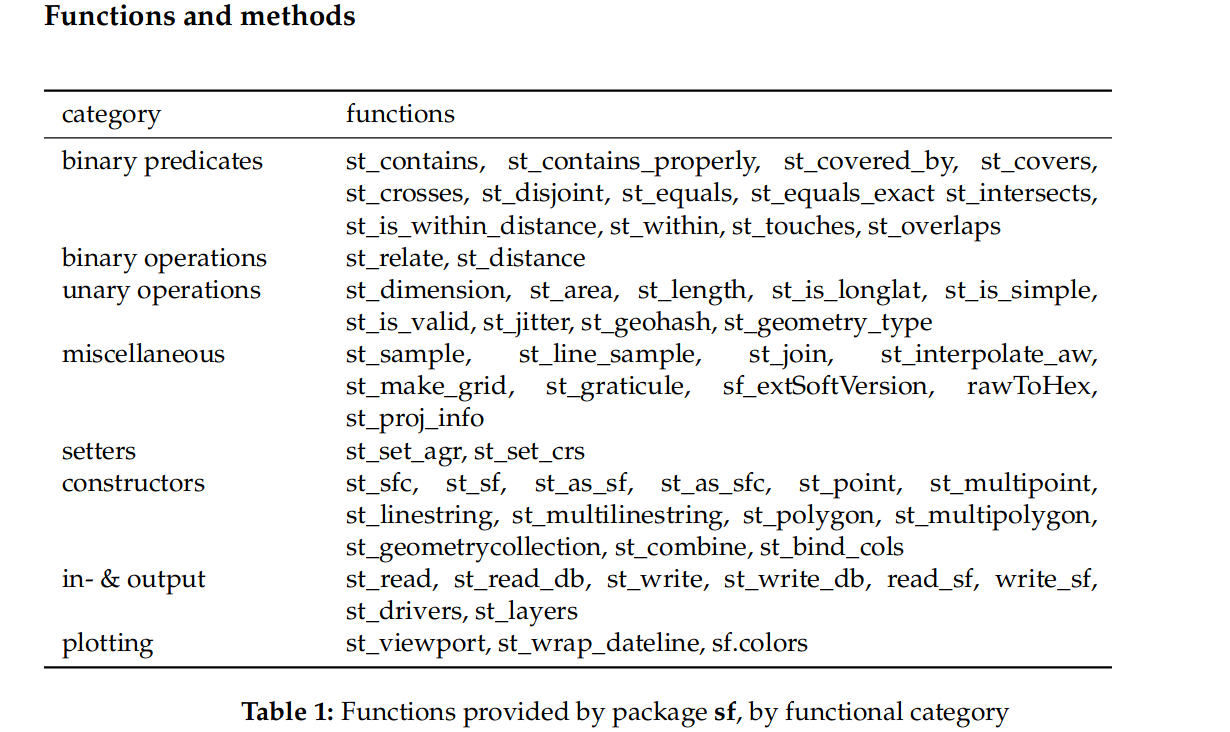
Source: Pebesma (2018)
sf + dplyr workflow
Mermaid graph:
Practical (~13:30-14:30)
Work through the code at ogh23.robinlovelace.net/tidy and answer the questions at your own pace.
Part 2: and friends
tidyverse alternatives
…
geos
…
References
Lovelace, Robin, Jakub Nowosad, and Jannes Muenchow. 2019. Geocomputation with R. CRC Press. https://r.geocompx.org/.
Pebesma, Edzer. 2018. “Simple Features for R: Standardized Support for Spatial Vector Data.” The R Journal. https://journal.r-project.org/archive/2018/RJ-2018-009/index.html.
Tidy geographic data with sf, dplyr, ggplot2, geos and friends