renv::snapshot()OpenGeoHub Summer School 2023
![]()
This repo contains code to support sessions that I will deliver for the OpenGeoHub Summer School 2023.
As shown in the course schedule I will deliver the following sessions:
- Tidy geographic data with sf, dplyr, ggplot2, geos and friends
- 2023-08-28, 11:00–12:30, Room 21 (Sala 21)
- 2023-08-28, 11:00–12:30, Room 21 (Sala 21)
- Processing large OpenStreetMap datasets for geocomputation
- 2023-09-01, 09:00–10:30, Room 18 (Sala 18)
Abstracts for these sessions are provided below.
Reproducibility
You can reproduce all of the results and run all the code in this repo. The quickest way to get started if you don’t already have the dependencies is with codespaces.
![]()
If it works you should see something like this:
To run the code locally download the code, e.g. with the following command after installing GitHub’s CLI tool:
gh repo clone Robinlovelace/opengeohub2023Then open the project in RStudio, VS Code, and start looking at and running the code. You should be able to reproduce the rendered website interactively with the following command:
quarto previewYou can also run the code in this repo in the Docker image hosted at https://github.com/Robinlovelace/opengeohub2023/pkgs/container/opengeohub2023 as follows, with the -v flag to mount the current directory in the container:
docker run -it -v $(pwd):/workspace opengeohub2023:latestIf you have VS Code installed you should be able to ‘Reopen in Container’ (not fully tested locally).
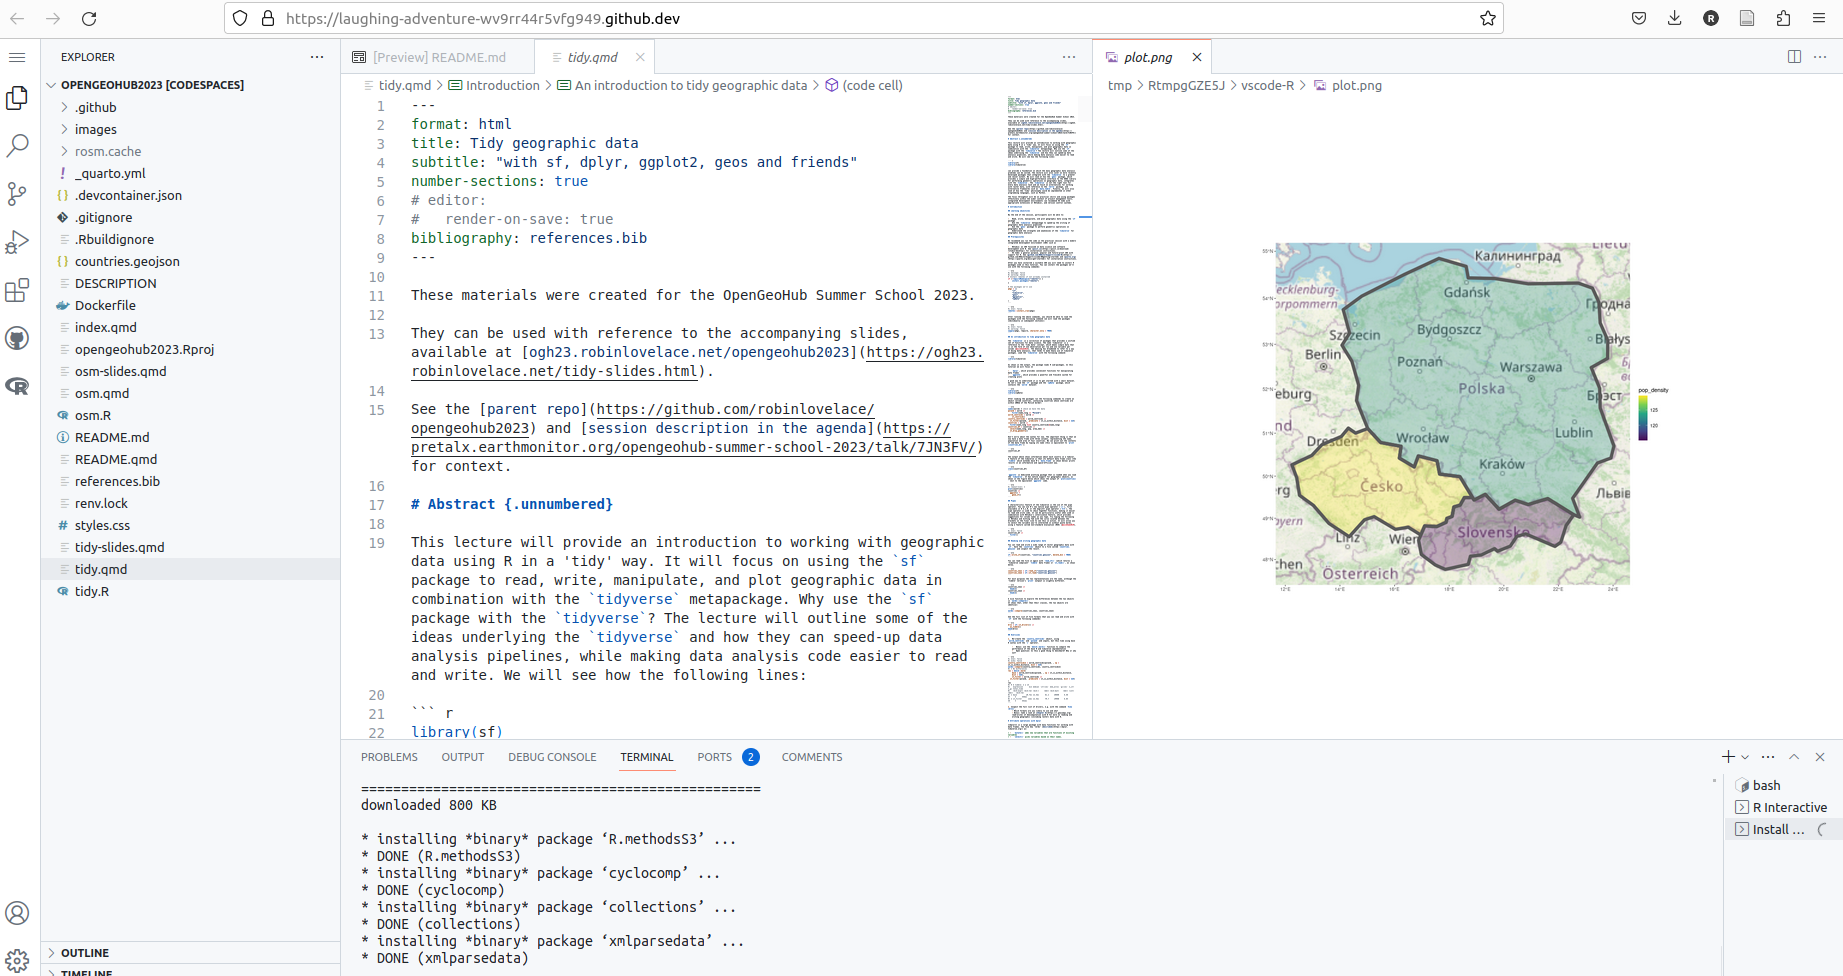
Tidy geographic data with sf, dplyr, ggplot2, geos and friends
This lecture will provide an introduction to working with geographic data using R in a ‘tidy’ way. It will focus on using the sf package to read, write, manipulate, and plot geographic data in combination with the tidyverse metapackage. Why use the sf package with the tidyverse? The lecture will outline some of the ideas underlying the tidyverse and how they can speed-up data analysis pipelines, while making data analysis code easier to read and write. We will see how the following lines
library(sf)
library(tidyverse)
can provide a foundation on which the many geographic data analysis problems can be solved. The lecture will also cover on more recently developed packages that integrate with the tidyverse to a greater and lesser extent. We will look at how the geos package, which provides a simple and high-performance interface to the GEOS library for performing geometric operations on geographic data, integrates with the tidyverse. The tidyverse is not the right tool for every data analysis task and we touch on alternatives for working with raster data, with reference to the terra package, and alternative frameworks such as data.table. Finally, we will also look at how the ‘tidy’ philosophy could be implemented in other programming languages, such as Python.
The focus throughout will be on practical skills and using packages effectively within the wider context of project management tools, integrated development environments (we recommend VS Code with appropriate extensions or RStudio), and version control systems.
Processing large OpenStreetMap datasets for geocomputation
OpenStreetMap (OSM) is a free and openly editable map of the world. Like Wikipedia and unlike government or corperation maintained datasets, OSM is created and maintained by a community of volunteers, making it the premier decentralized and fastest evolving source of geographic vector data focussed on features relevant to human activity (e.g. roads, buildings, cafes) on planet Earth. Unlike Wikipedia, every data point in OSM has a geographic location and attributes must be structured as key-value pairs. OSM is a rich source of data for geocomputation, but the decentralized nature of the project and the sheer volume of data. ‘Planet.osm’ now has more nodes than there are people on Earth, with more than 8 billion nodes, and the rate of data creation is increasing as the community grows, to 10 million users in early 2023. The size and rapid evolution of OSM are great strengths, democratising geographic knowledge and ensuring resilience. However, these features can make it difficult to work with OSM data.
This lecture will provide an introduction to working with OSM and will cover the following:
- How and where to download OSM data
- How to process small amounts of OSM data using the
osmdataR package - How to process large OSM ‘extracts’ data with the
osmextractR package - Other command line tools for working with OSM data, including the mature and widely used
osmiumtool, thepyrosmPython package and theosm2streetsweb application and Rust codebase
Finally, the lecture will outline ideas for using OSM data. It will conclude with a call to action, inspiring the use of this rich resource to support policy objectives such as the fast and fair decarbonisation of the global economy as societies transition away from inefficient, polluting and costly fossil fuels.
Reproducibility
To install the dependencies for this repo, run the following command:
remotes::install_github("robinlovelace/opengeohub2023")This repo also uses the renv package to manage dependencies. We saved the dependencies with the following command:
Code was generated from the .qmd files using the following commands:
f = c("tidy.qmd", "osm.qmd")
f_r = gsub(".qmd", ".R", f)
for(i in seq_along(f)) {
  knitr::purl(f[i], f_r[i])
}
This is a Quarto website.
To learn more about Quarto websites visit https://quarto.org/docs/websites.
The content below was rendered from README.qmd in the robinlovelace/opengeohub23 GitHub repository where you can find the source code for this website.